This article explains how to access and examine statistics on questions in the selected question pool. There is a report on candidates’ performance on each question pool, graphical representations of questions broken down by type, and difficulty level.
Accessing the question pool
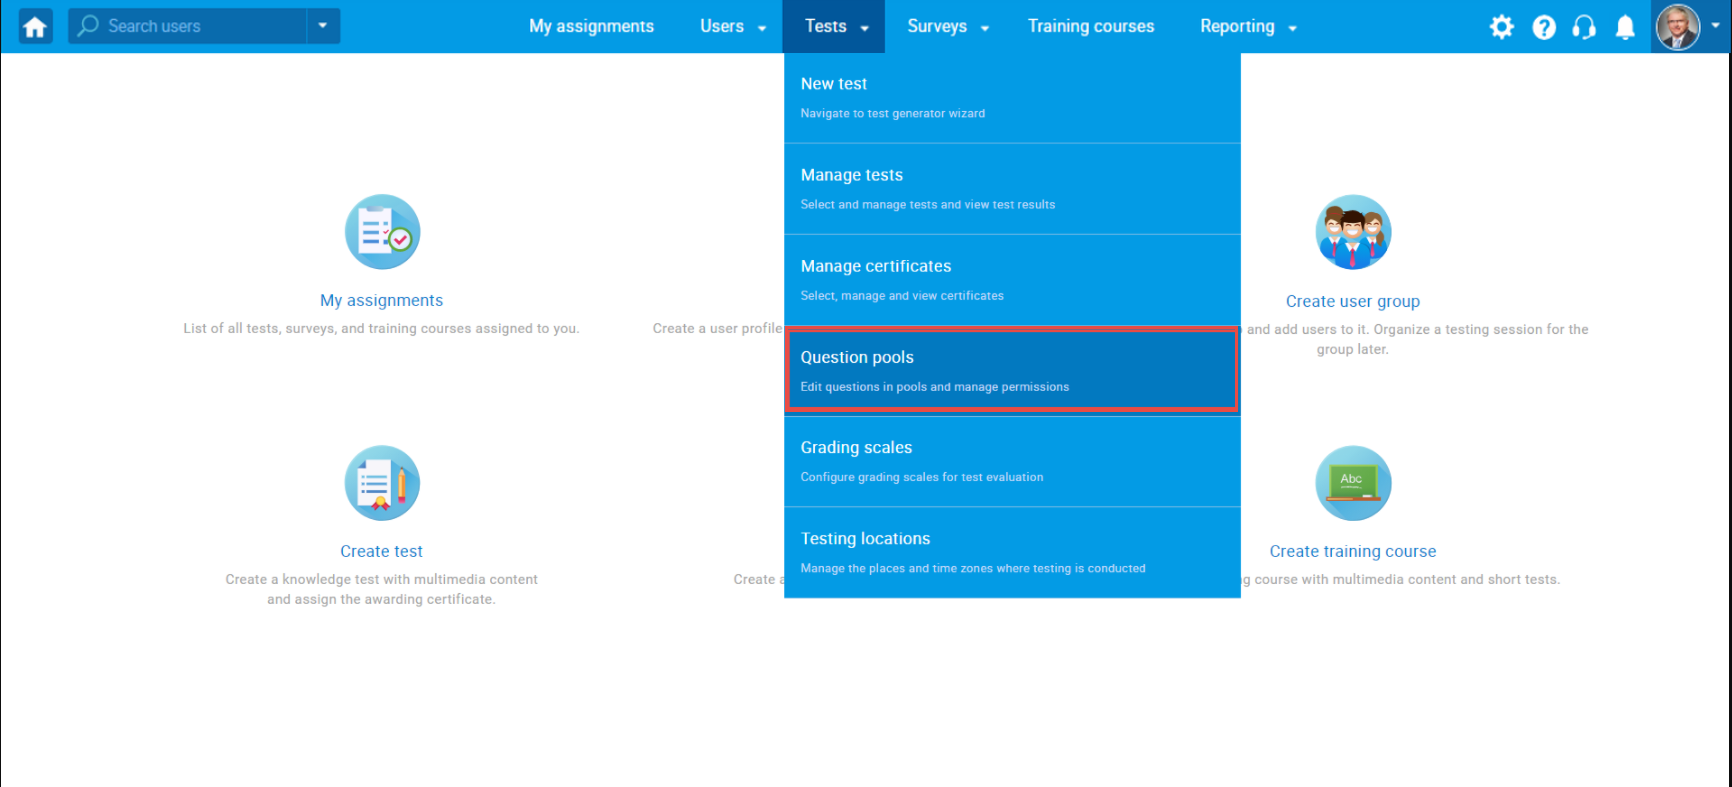
To open statistical reports, hover over the “Tests” in the main menu and select “Question pools”.
Choosing the question pool
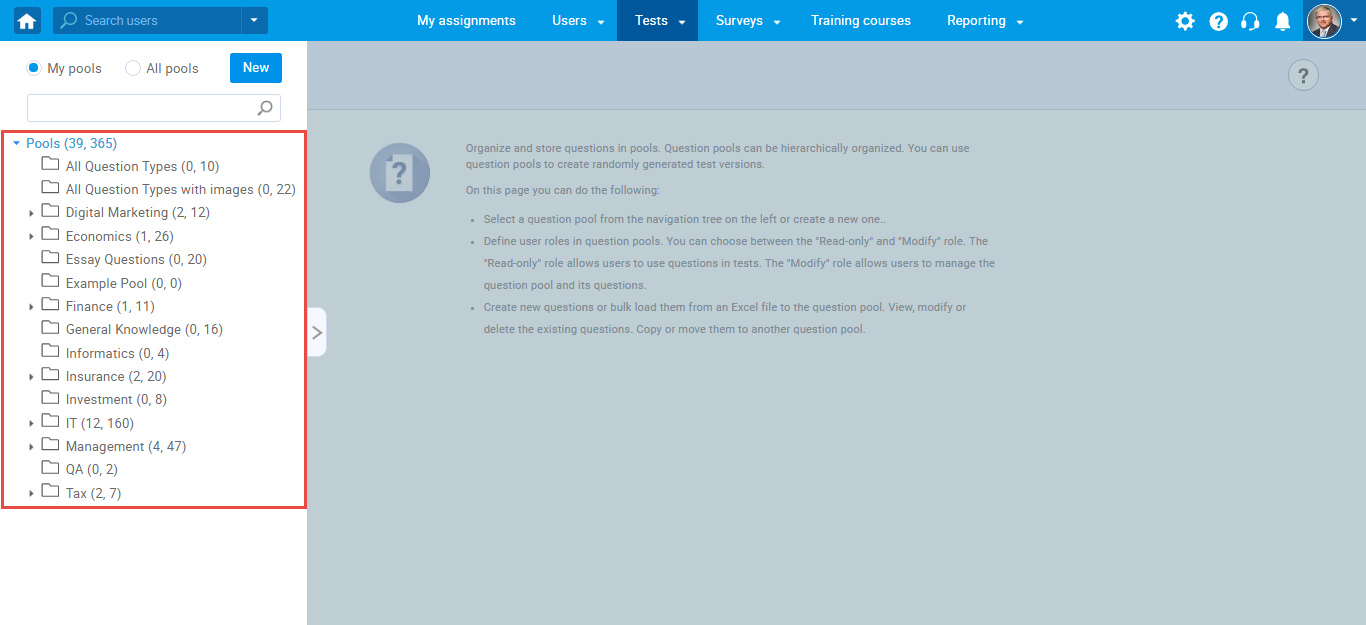
On the left, you will see a list of all the question pools n the system, Click on the name of the desired pool to open it.
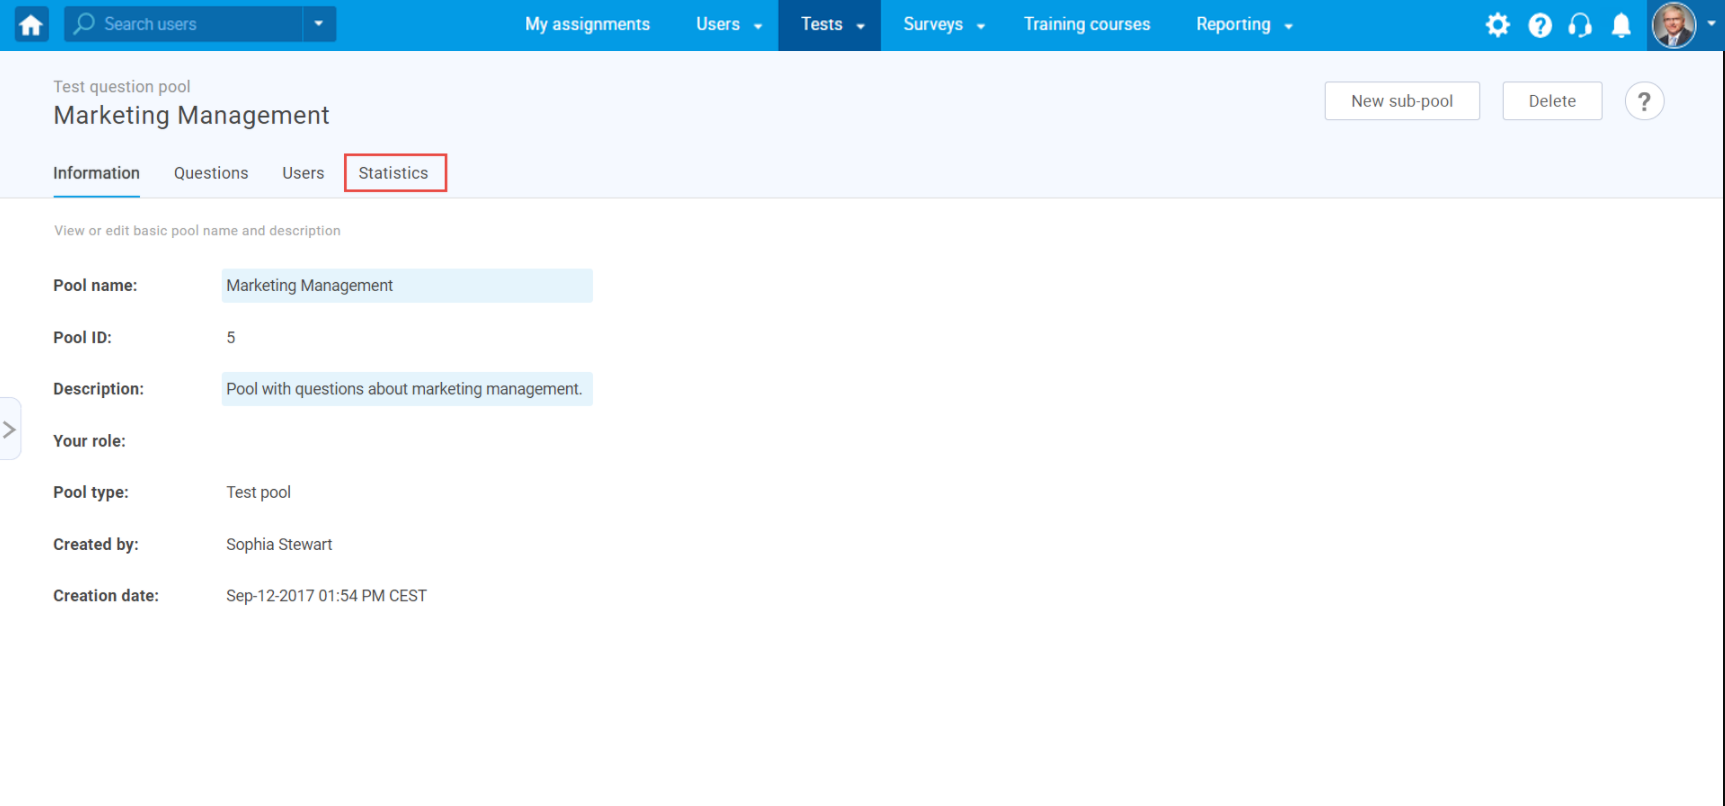
Once you open the desired question pool, navigate to the “Statistics” tab.
Previewing statistics
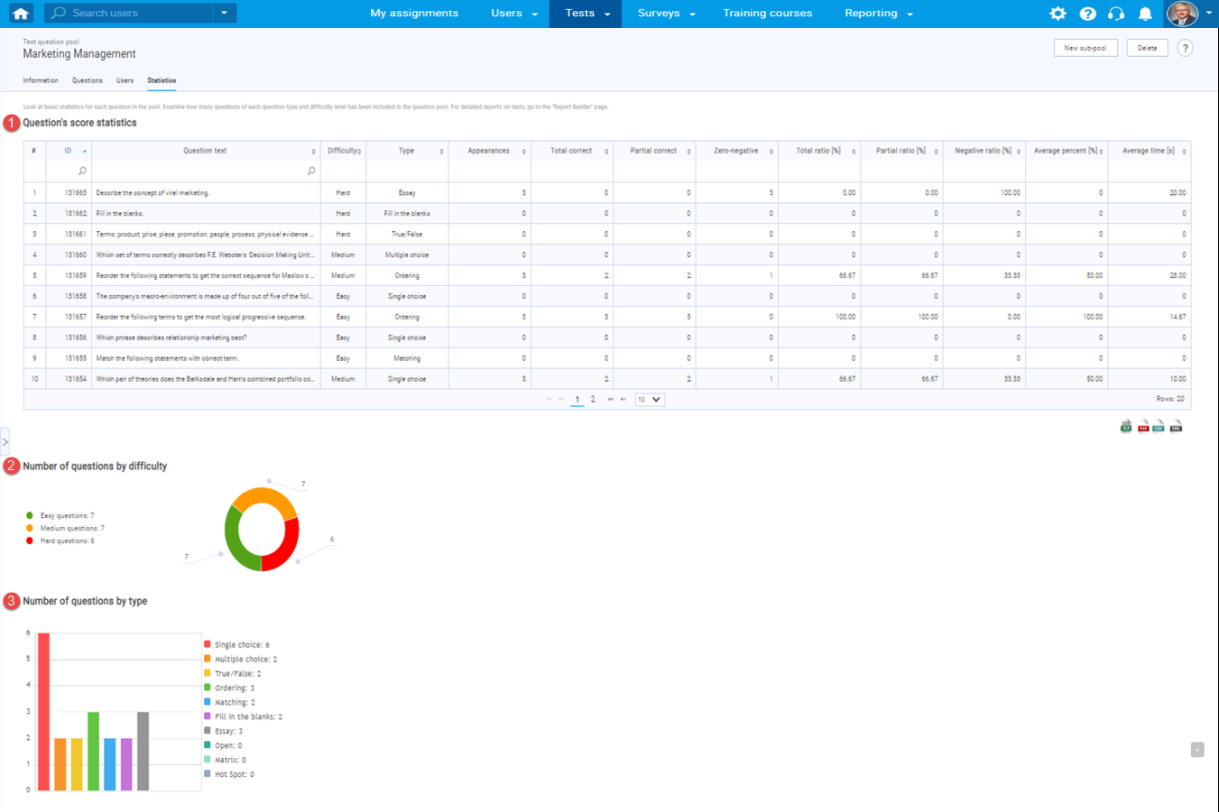
1. “Candidates performance on question pool”
The “Candidates performance on question pool” is a table of basic statistics of questions that shows the candidate’s performance on the questions, along with basic information about questions. These statistics and data include:
- The “ID” represents the question ID in the system.
- The “Question text” is question content.
- The “Difficulty” represents the question difficulty level. It can be easy, medium, or hard.
- The “Type” is the question type. It can be a single choice question, multiple-choice question, essay question, ordering question, fill in the blanks question, true/false question, etc.
- The “Appearances” is the number of times the question occurred in all tests in the system.
- The “Total correct” is the number of correct answers to the question in all tests in which the question occurs.
- The “Partial correct” is the number of answers to the question that had points between zero and the maximum possible points in all tests in which the question occurs.
- The “Zero-negative” is the number of answers to the question on which zero or fewer points were achieved in all tests on which the question appears.
- The “Total ratio” is the ratio of “Total correct” and “Appearances” columns in percent.
- The “Partial ratio” is the ratio of “Partial correct” and “Appearances” columns in percent.
- The “Negative ratio” is the ratio of “Zero-negative” and “Appearance” columns in percent.
- The “Average percent” is the average percentage of points scored on the question.
- The “Average time” is the average time the candidates spent on answering the question.
2. “Number of questions by difficulty”
The “Number of questions by difficulty” is the graph of the distribution of questions by difficulty in the selected pool of questions. Displays the number of questions for each difficulty.
3. “Number of questions by type”
The “Number of questions by type” is the graph of the distribution of questions by type of question in the selected pool of questions. Displays the number of questions for each type of question.
You can examine various other question reports in the predefined reports. For more information on how to access them, please visit Predefined reports.
For more related instructional materials, please visit:
- How to create and use question pools
- How to bulk import questions to the question pool using an Excel file
- How to create a new question within a question pool


