This article explains the process of previewing a report that contains the number of connected users.
To preview a report that contains the number of concurrent users, do the following:
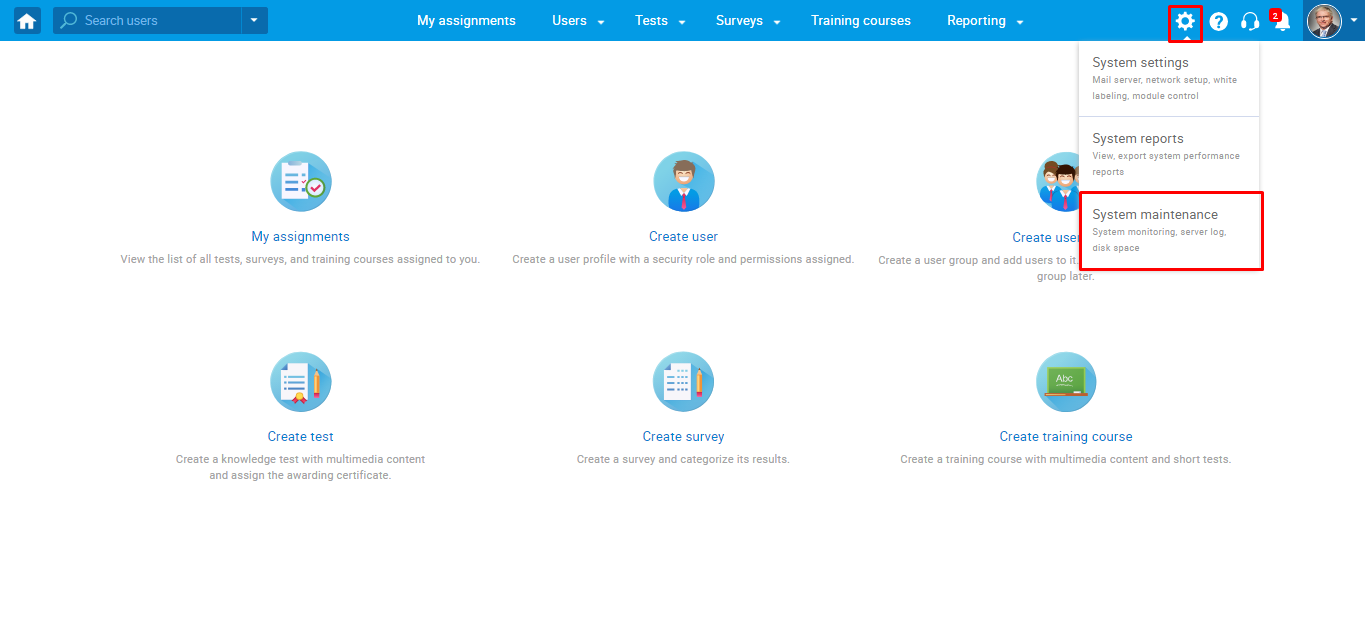
- Click the “tool” icon- System.
- Navigate to “System maintenance.”
Then:
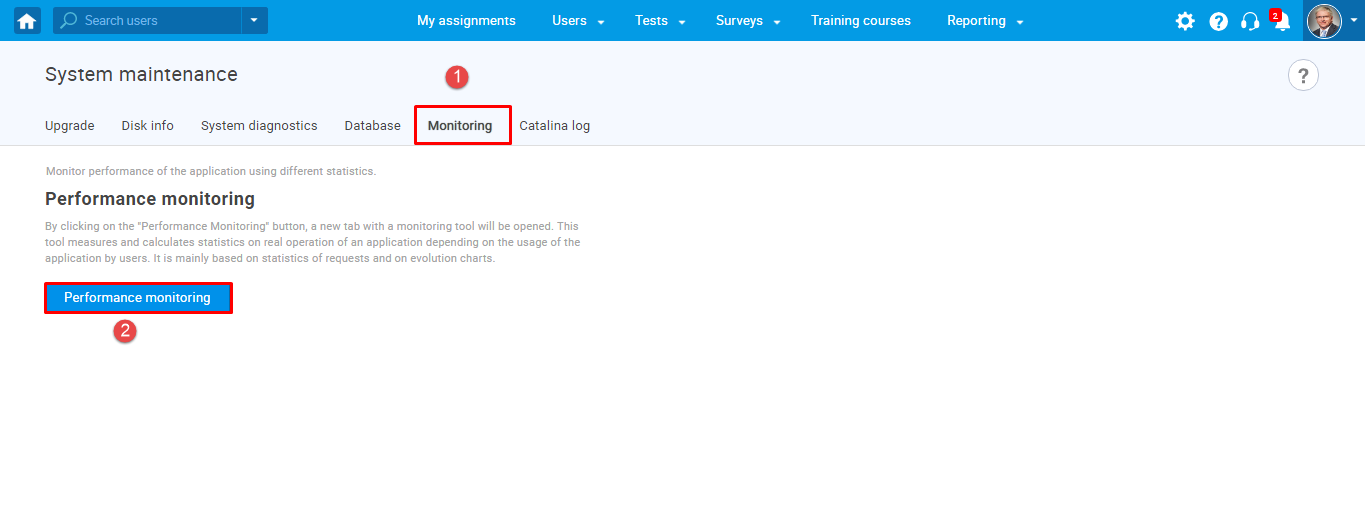
- Navigate the “Monitoring” tab
- Click the “Performance monitoring ” button.
There are two ways to view the statistics report containing the number of concurrent users:
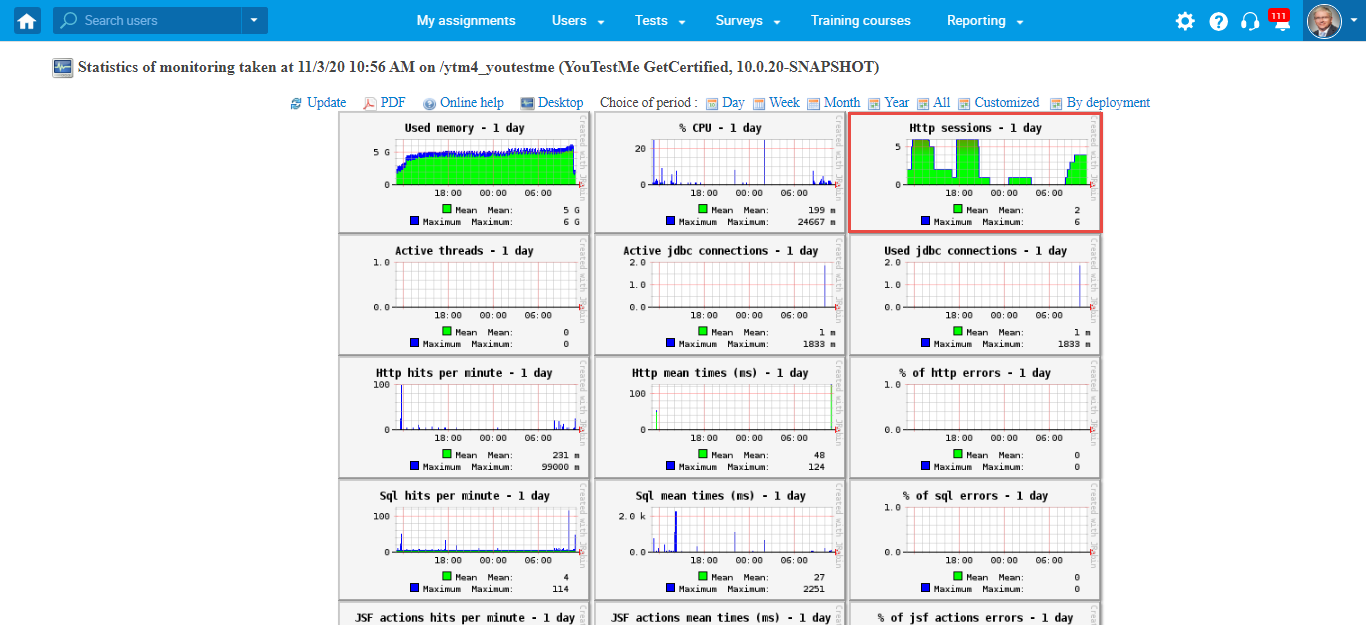
- Click the “HTTP sessions” to preview connected users’ reports during the time you choose (During the day in this case).
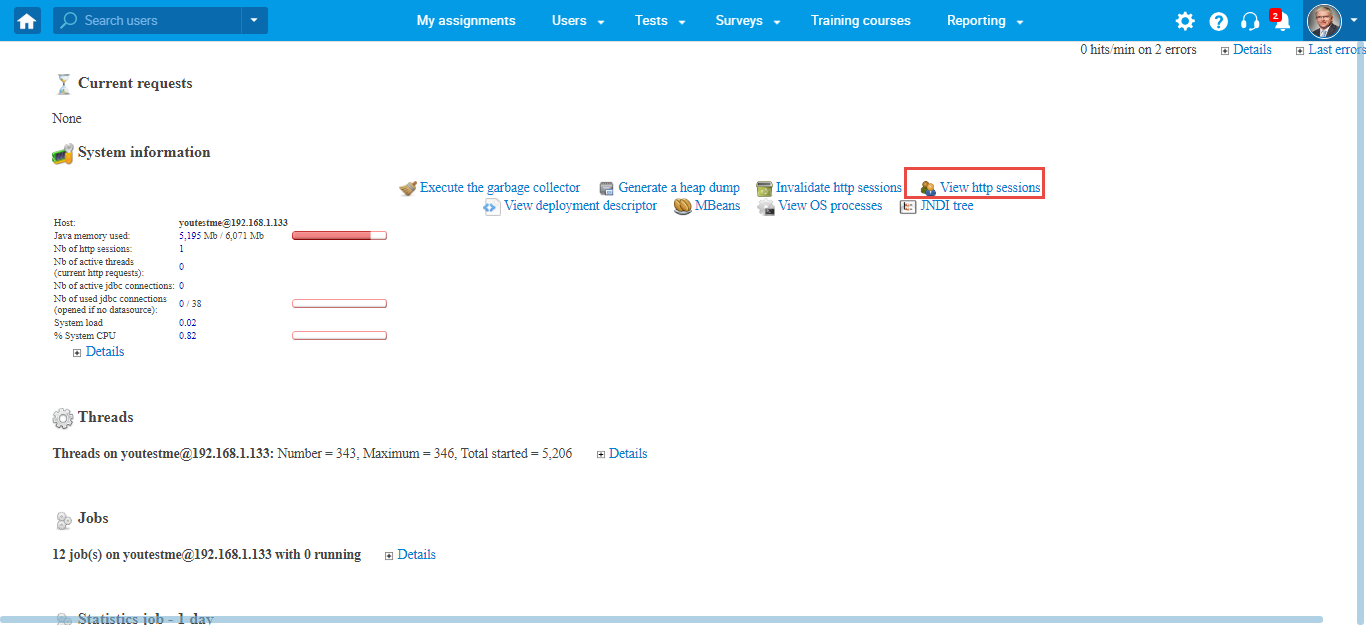
- On the same page, under the System information, click the link “View HTTP sessions.”
The first way to preview a report – Click the HTTP sessions
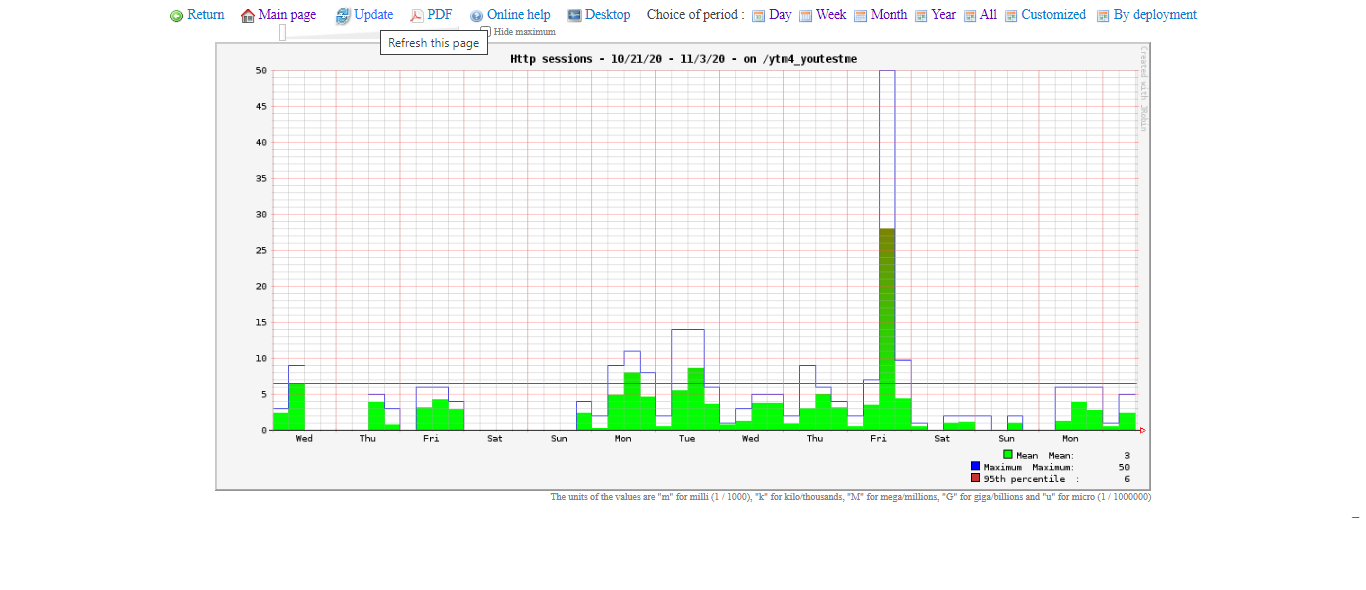
You can see on the picture the statistics of monitoring taken on the exact date and the exact time divided by categories.
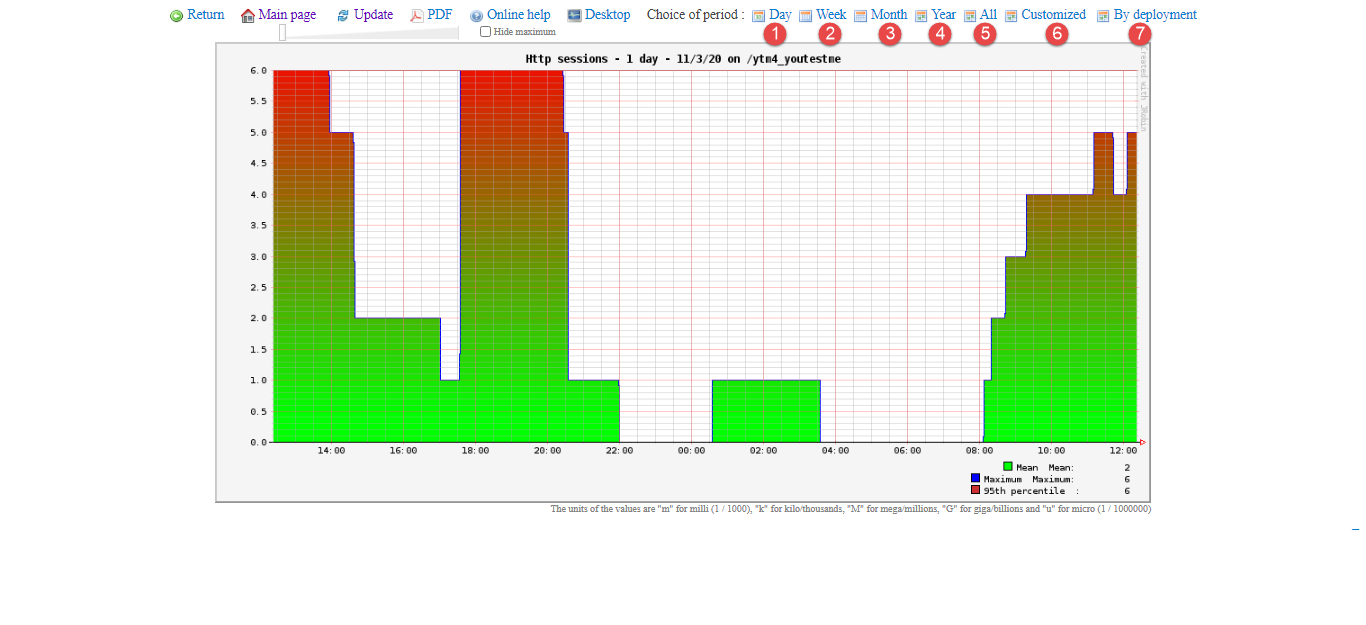
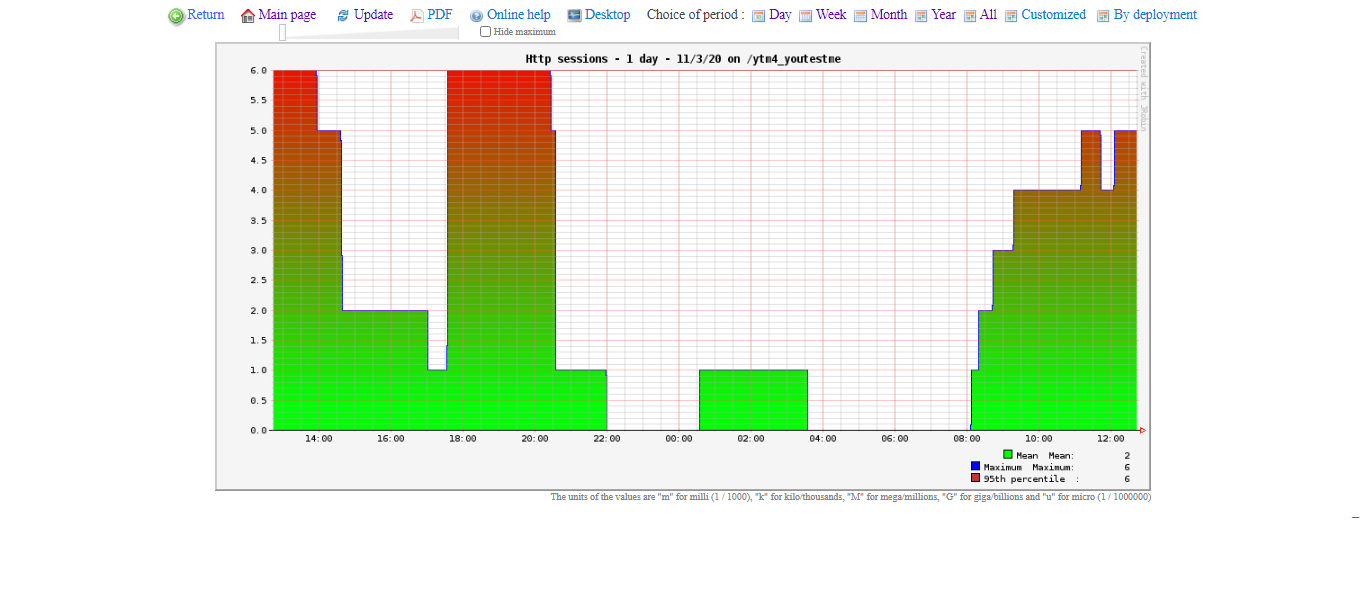
After choosing the “HTTP sessions-1 day “option, you can see the report that shows the number of HTTP sessions per day. The report shows the duration of the session by each user. The number of users signed in the application within the time shows on the chart. The monitoring tool tracks the number of users signed in the session measured by a time.
Take a look at the chart report below, and there you can preview the number of HTTP sessions during a day.

Note: One HTTP session is equivalent to the one signed-in user.
There are the following actions available with the HTTP sessions report:
- Return back – returns you to the monitoring home page.
- Return to the monitoring page (monitoring home page).
- Update the chart (report).
- Display reports in PDF format.
- Display online help on a new page– opens the help of a monitoring tool.
- Download the monitoring tool on your computer.

One more option is available, and that is that you can change the period you will preview the report. You can choose:
- Day – preview daily statistics report.
- Week – preview weekly statistics report.
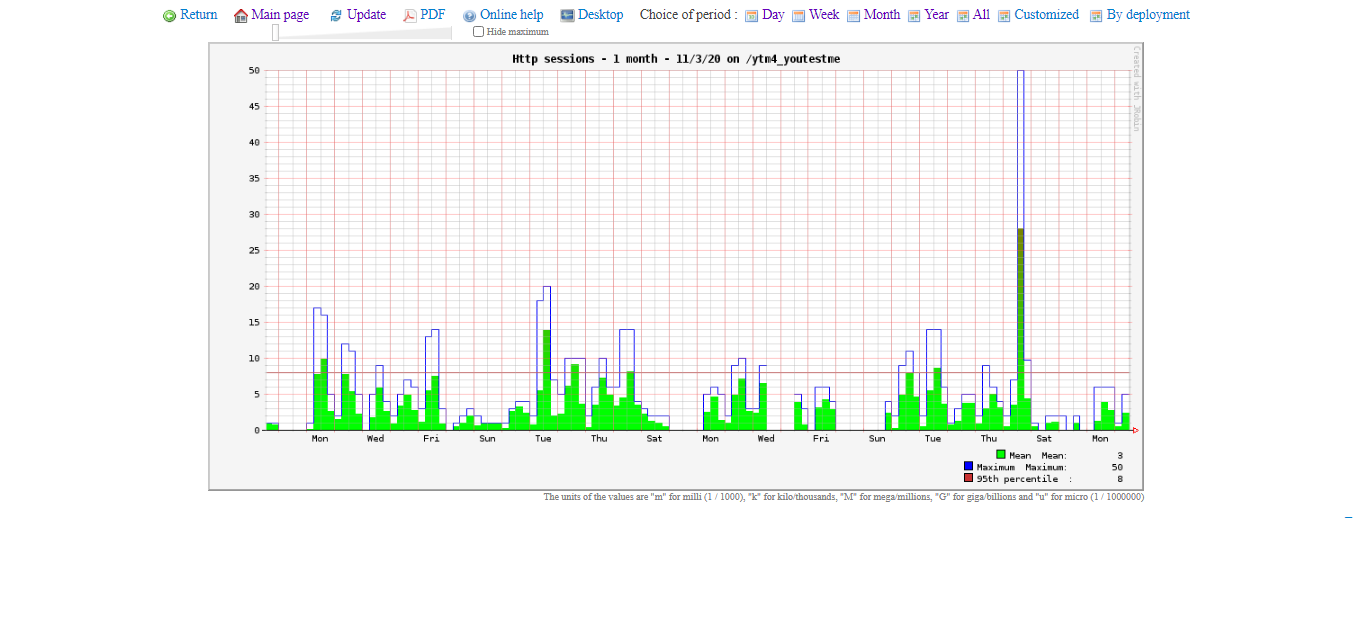
- Month – preview monthly statistics report.
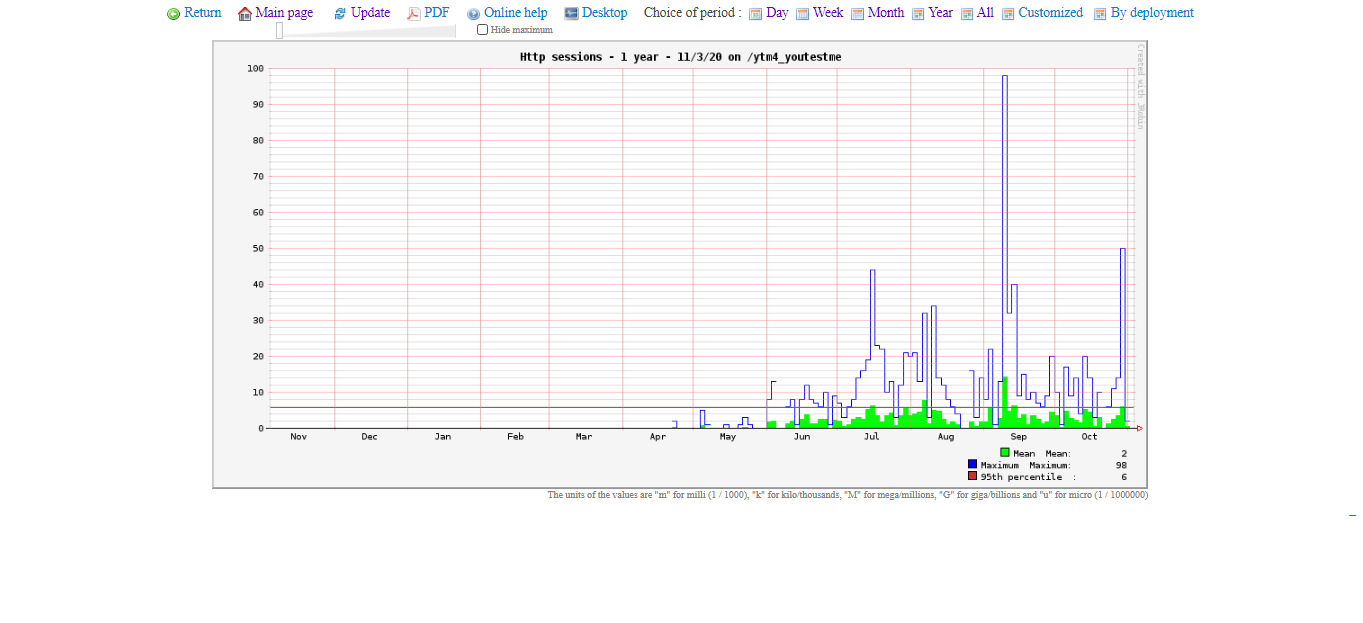
- Year – preview yearly statistics report.
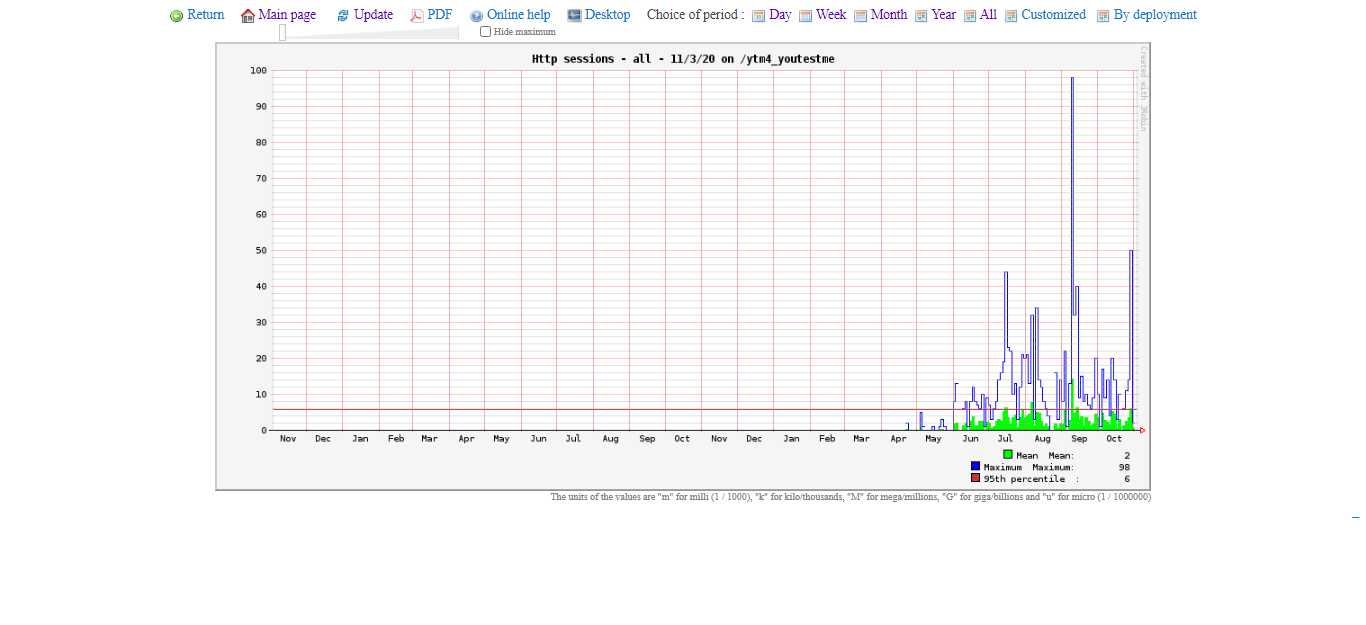
- All – preview the report of all periods.
- Customized – select the period from date to date to show the report.
- By deployment – choose the version of a system to preview to report.
Connected users daily statistics report
Connected users weekly statistics report

Connected users monthly statistics report
Connected users yearly statistics report
Connected users report – all the periods
Connected users – Customized report
Connected users – By deployment report

The second way to preview a report – Click the “View HTTP sessions” link
You can see the following columns in the report:
- Session ID – the identification number of a session.
- Last access – the moment when the user accessed the session.
- Age – represents the duration of a session.
- Expiration – the exact time when the session expires.
- IP address – represents the IP address of a user.
- Country – the location of the user signed-in the HTTP session.
- Browser – the browser from which the user started the session.
- OS – the operating system of a user’s computer.
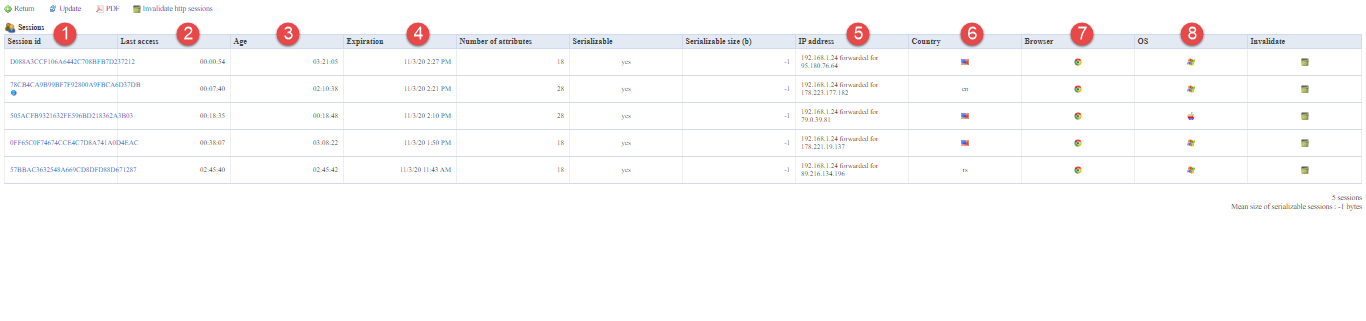
Note: These columns attributes are essential for an administrator and the statistical analysis. The fields “Number of attributes”, “Serializable,” and “Serializable size” are the additional attributes in the table.
You can perform the following actions as well:
- Return back.
- Update the table.
- Display the report in PDF format.
- Invalidate the HTTP sessions.


